Do more sunspots mean a stronger storm?
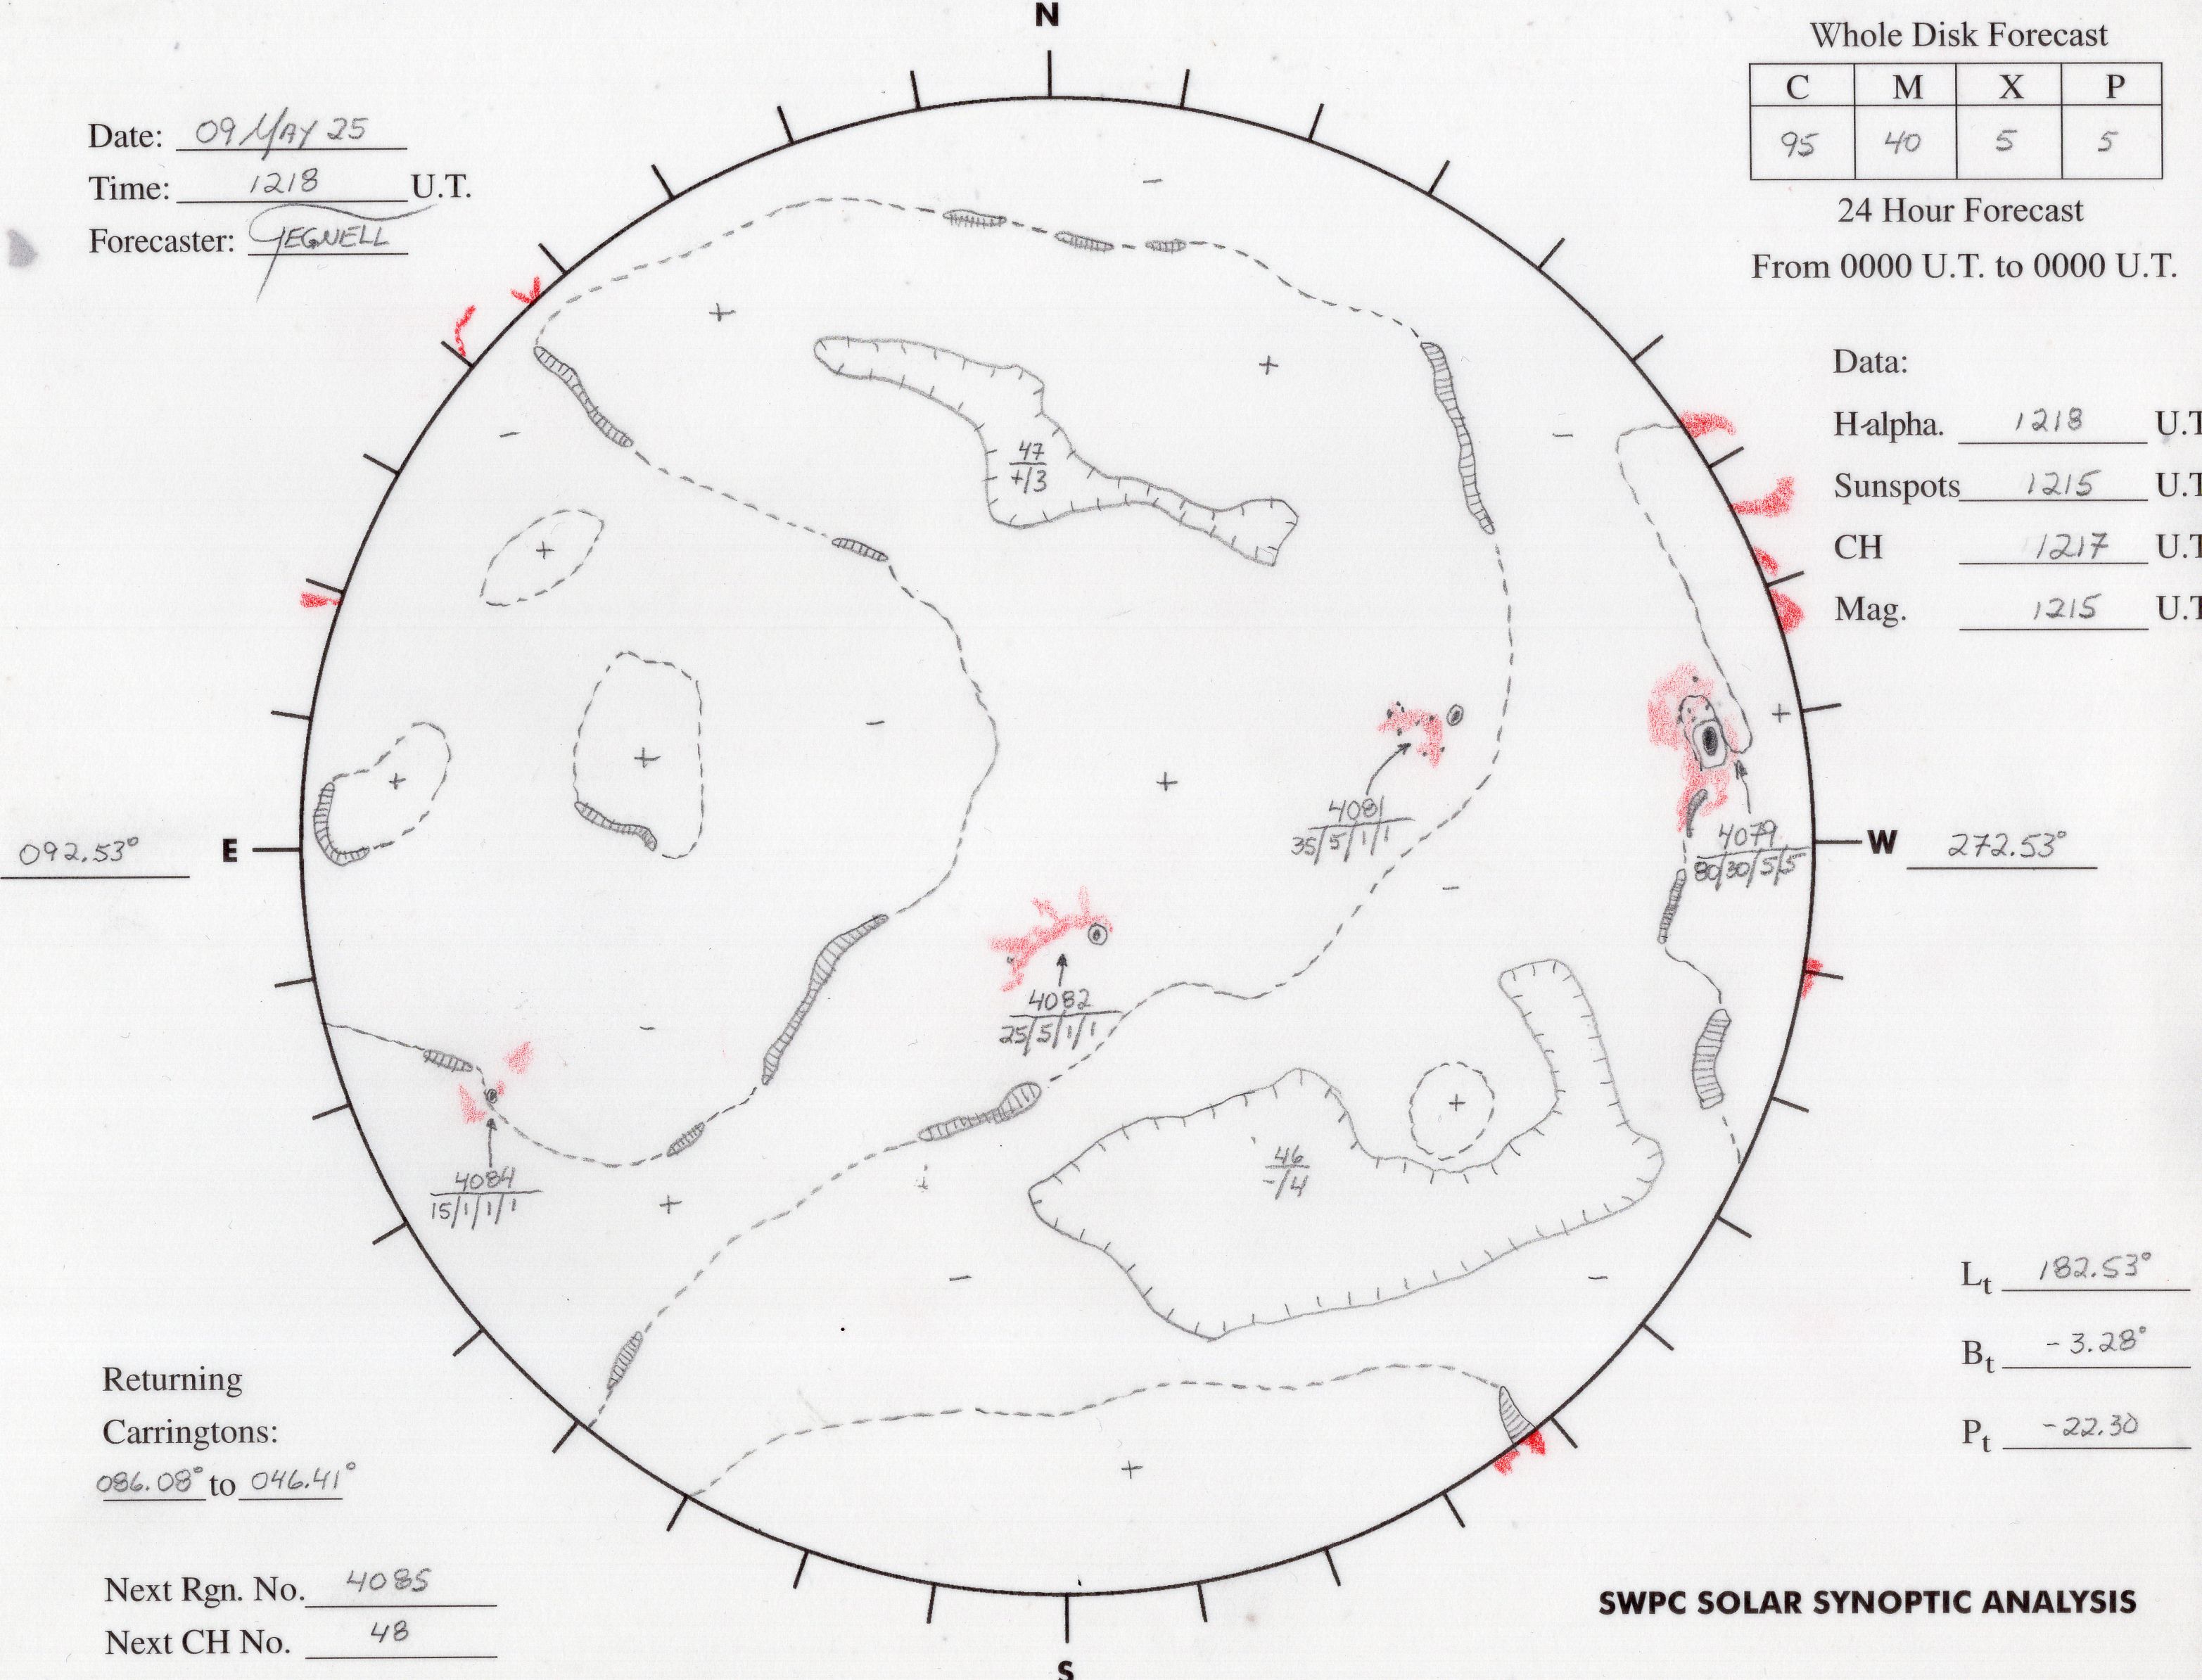
Sunspot count alone is not enough. Region size and magnetic complexity help assess flare potential, but neither predicts a storm at Earth.
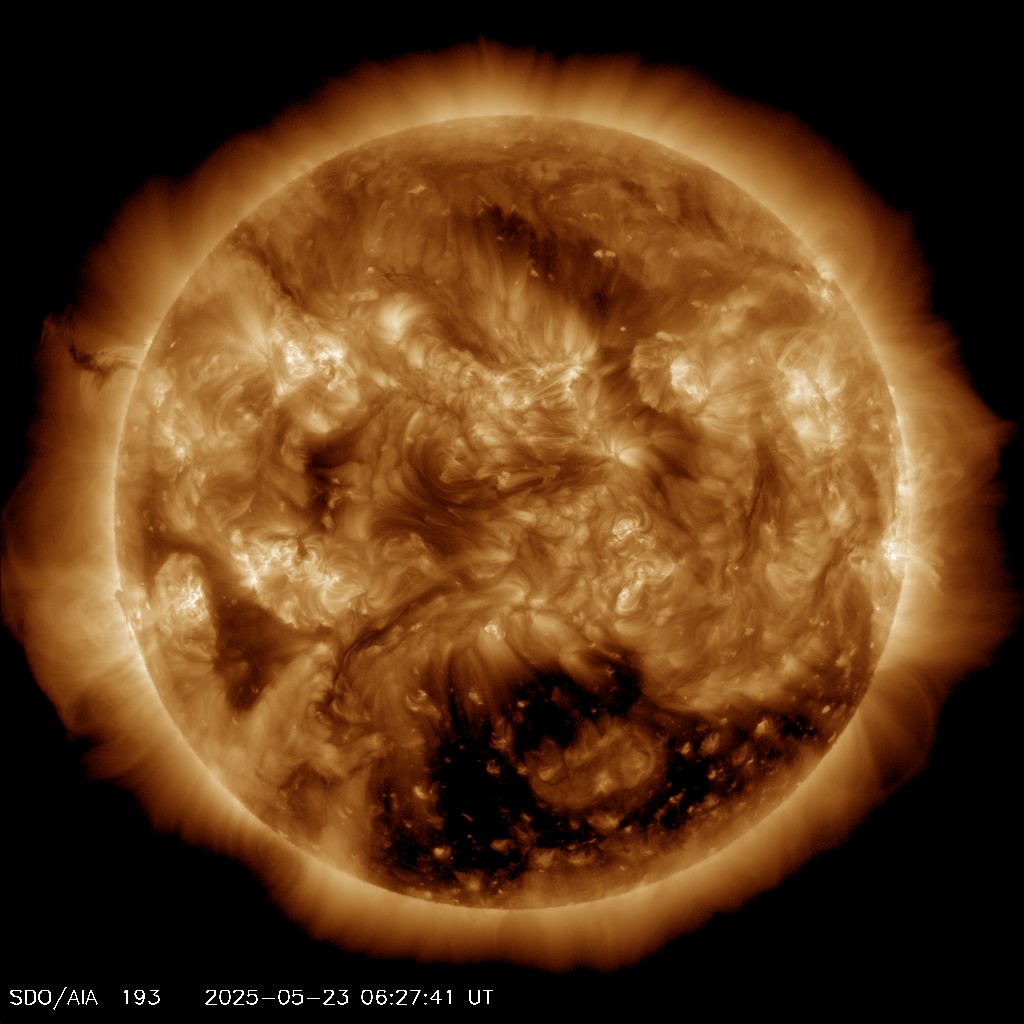
See what is happening on the Sun: sunspots mark active regions, while dark coronal holes can release faster solar wind.
Flare strength runs from A through B, C and M to X. At the same number, each letter class is ten times stronger than the previous one.
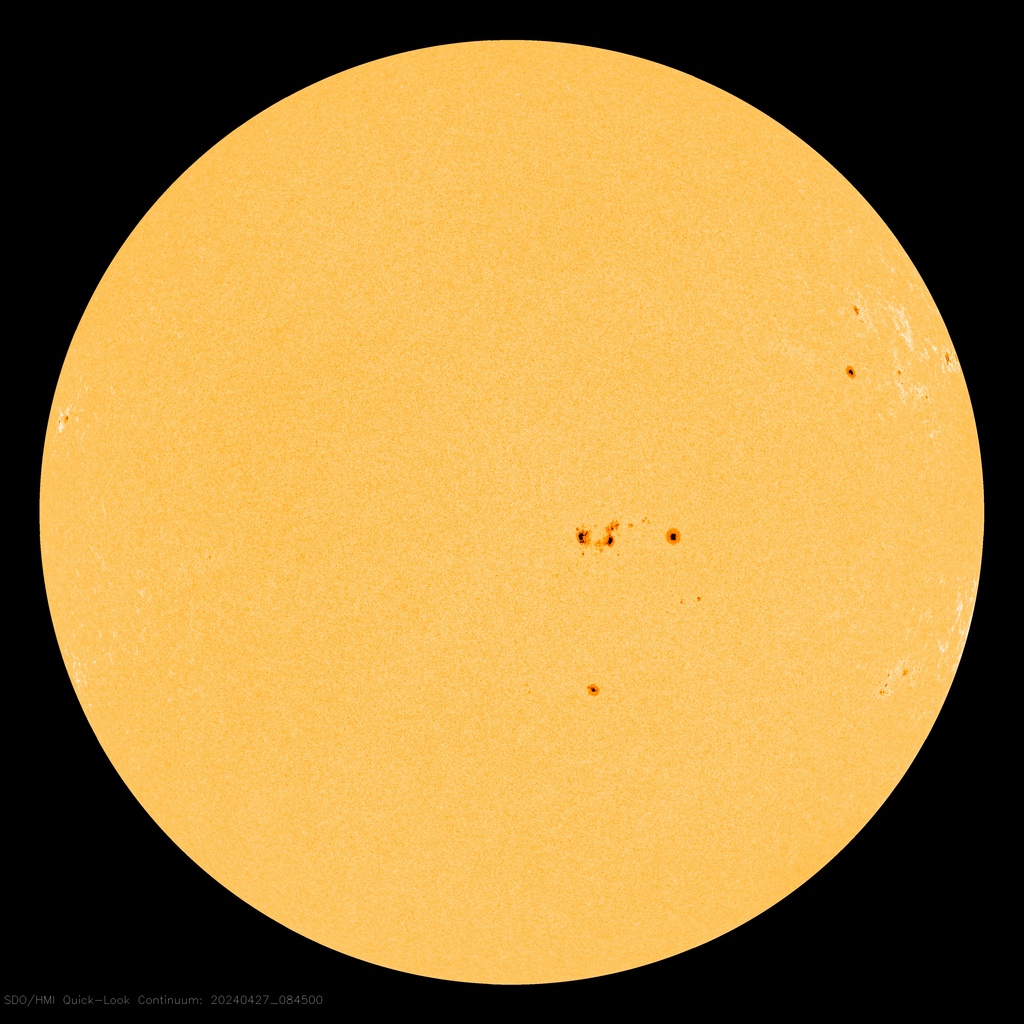
| Region | Location | Sunspots | Area (MH) | Classification | C / M / X |
|---|---|---|---|---|---|
| 4565 | N12E61 | 1 | 60 | A · Hsx | 0% / 0% / 0% |
| 4563 | S19W0* | 1 | 10 | A · Axx | 0% / 0% / 0% |
| 4564 | N04E41 | 4 | 30 | B · Cro | 0% / 0% / 0% |
Image colours depend on the instrument and wavelength. Compare images from the same channel; a dark coronal hole is not a hole in the Sun.
Sunspot count alone is not enough. Region size and magnetic complexity help assess flare potential, but neither predicts a storm at Earth.
It can suggest a region to watch as the Sun rotates. It cannot establish the time, strength or Earthward direction of a future eruption.
Public scientific observations and forecasts may be delayed or revised. Forecasts are not guarantees of aurora visibility or operational safety. Follow official advice for critical decisions.